
Figure 2.

(a) Inter-amino-acid intervals and protein cleavage procedure exemplified for the full B.taurus insulin sequence. Full vertical lines indicate the positions of two specific amino acids K (orange) and R (green) and intervals between their positions are shown by horizontal lines of the same color. Dashed vertical lines indicate specific cleavage positions by Trypsin (cleavage at C-terminal side of either ‘K’ or ‘R’). Molecular masses of oligopeptides obtained after successful cleavage of the polypeptide chain are annotated at the horizontal lines. (b) Exceedance probability distribution functions  of the inter-amino-acid intervals and (c)
  of the oligopeptide masses for the same sample protein in the units of average intervals L and average masses M, respectively. Arrows show the distances
 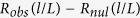 and
and 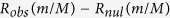 between the observational and the theoretical exponentially decaying exceedance probability distribution functions
 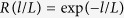 and
and 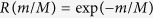 (shown by dashed lines) representing the null hypothesis (random allocation of amino acids) for the interval and the mass distributions, respectively.