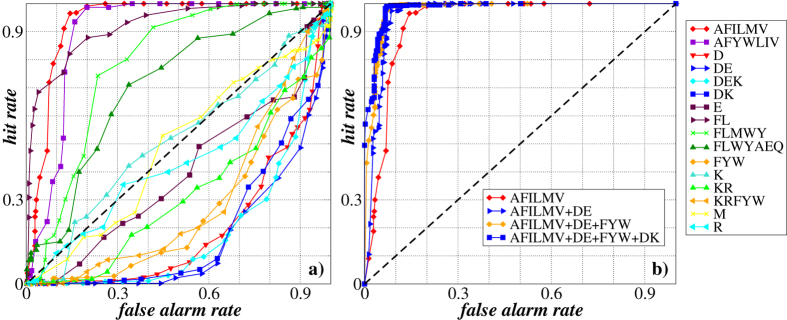
Figure 6.
(a) The receiver operator characteristic (ROC) curves characterizing the potential prediction accuracy of transmembrane proteins carrying either α-helixes or β-sheets in their secondary structure according to the oligopeptide mass distributions exemplified for 16 different cleavage rules. (b) The ROC curves for the binary logistic regression models representing one to four best linear combinations of predictors using different cleavage rules. The areas under the curves (AUC) are 0.935, 0.961, 0.976 and 0.983, while the Nagelkerke  coefficients of determination are 0.727, 0.814, 0.863 and 0.875 for one, two, three and four cleavages used, respectively.

