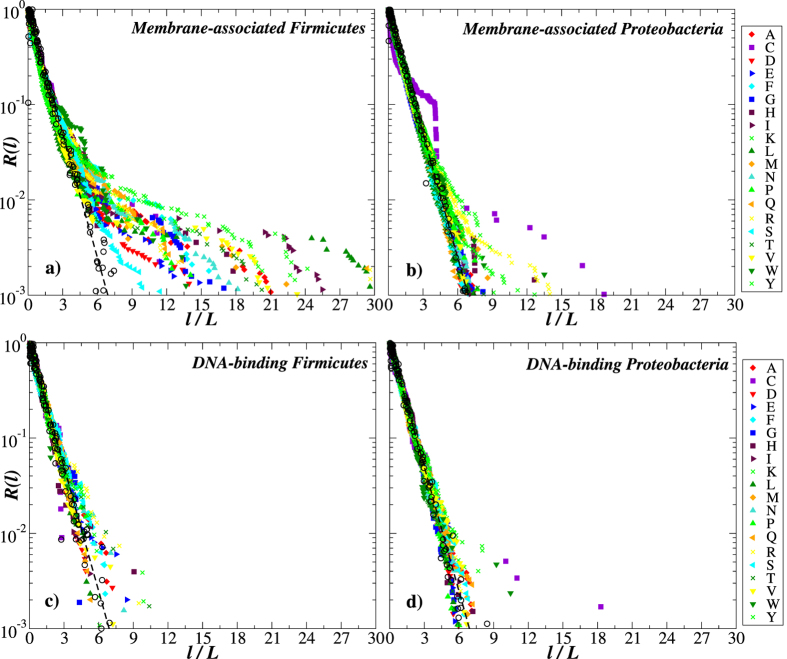
Figure 7.
The exceedance probability distributions of the intervals between amino acid residues in (a,b) membrane-associated and (c,d) soluble proteins of (a,c) Firmicutes and (b,d) Proteobacteria. For comparison, the open black circles show the same distributions for the shuffled amino acid sequences, while the dashed lines show simple exponentials  .
.

