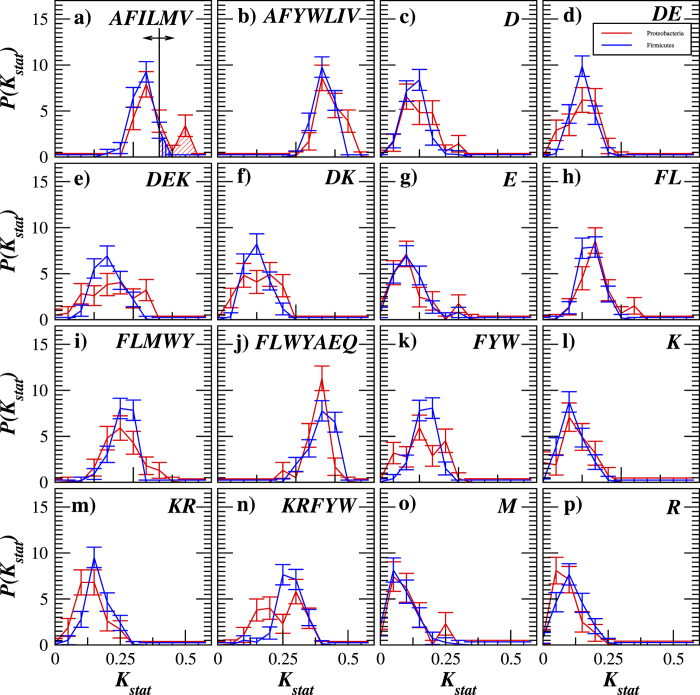
Figure 9. The empirical PDF estimates of Kstat values in the adhesion and invasion factors of pathogenic Firmicutes (red) and Proteobacteria (blue).
The black vertical line in (a) indicates a variable decision threshold  used to calculate a ROC-curve, while the diagonal and the vertical filled areas denote the hit rate and the false alarm rate for the chosen threshold
  , respectively.

