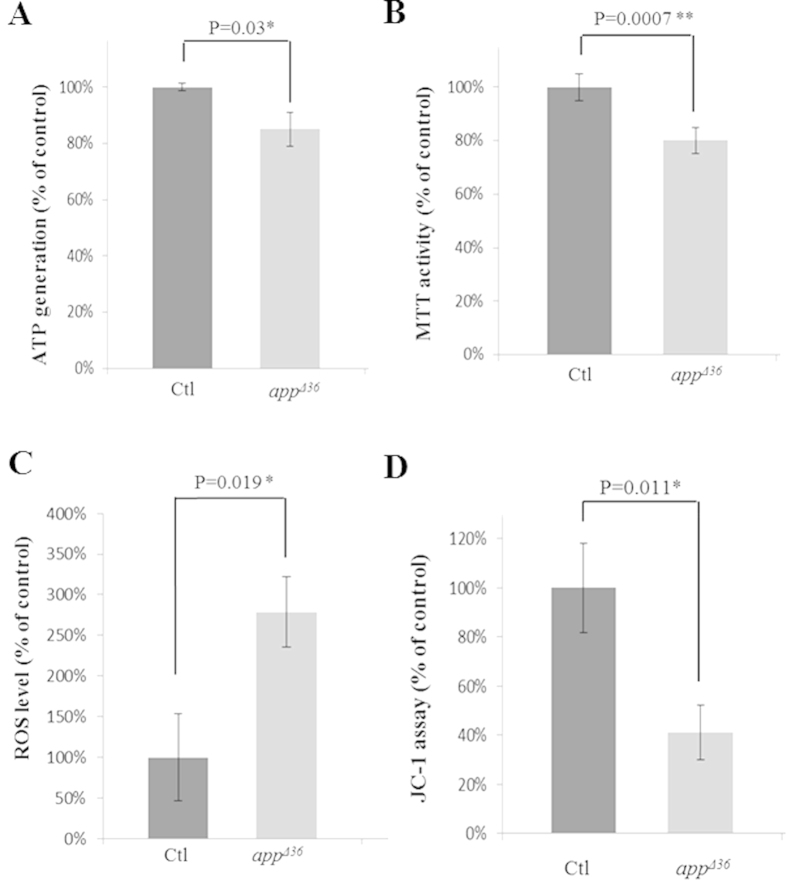
Figure 5. Mitochondrial function is impaired in appΔ36 cells.
The ATP generation (A), MTT activity (B), ROS levels (C) and the JC-1 assay (D) are shown. Error bar represents mean ± SD. Statistically significant differences are shown with asterisks (*P < 0.05 versus control, **P < 0.01 versus control).

