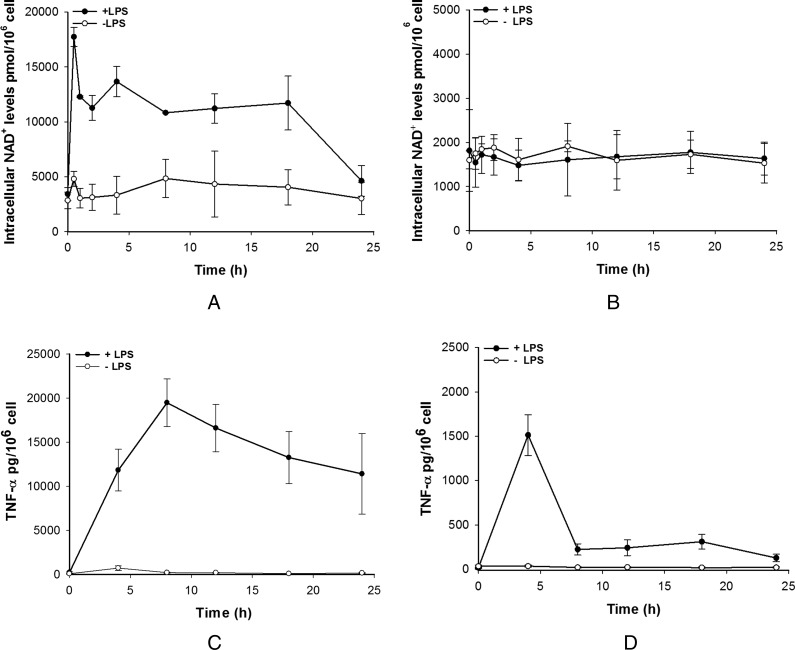
Figure 1. Intracellular NAD+ and TNF-α levels in THP-1-derived macrophages subsets.
LPS effect on NAD+ levels in pro-inflammatory (A; M1-like) and anti-inflammatory (B; M2-like) macrophages. TNF-α levels in M1-like (C) and M2-like (D) macrophages after LPS challenge. Data shown are mean±S.E.M. for three separate experiments (n=3).

