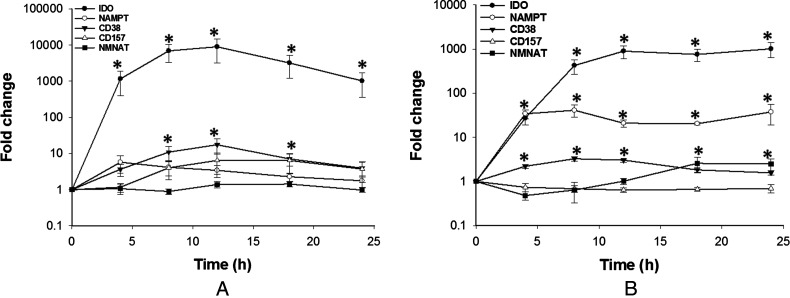
Figure 6. Gene expression profile of NAD+ homoeostasis enzymes in M1-like (A) and M2-like (B) macrophages after LPS challenge.
Gene expression is expressed as fold change relative to the control. Data shown are mean±S.E.M. for three separate experiments (n=4). The data were analysed by one-way ANOVA. *P<0.05.

