
Figure 4. Kinetic replication curve analyses.
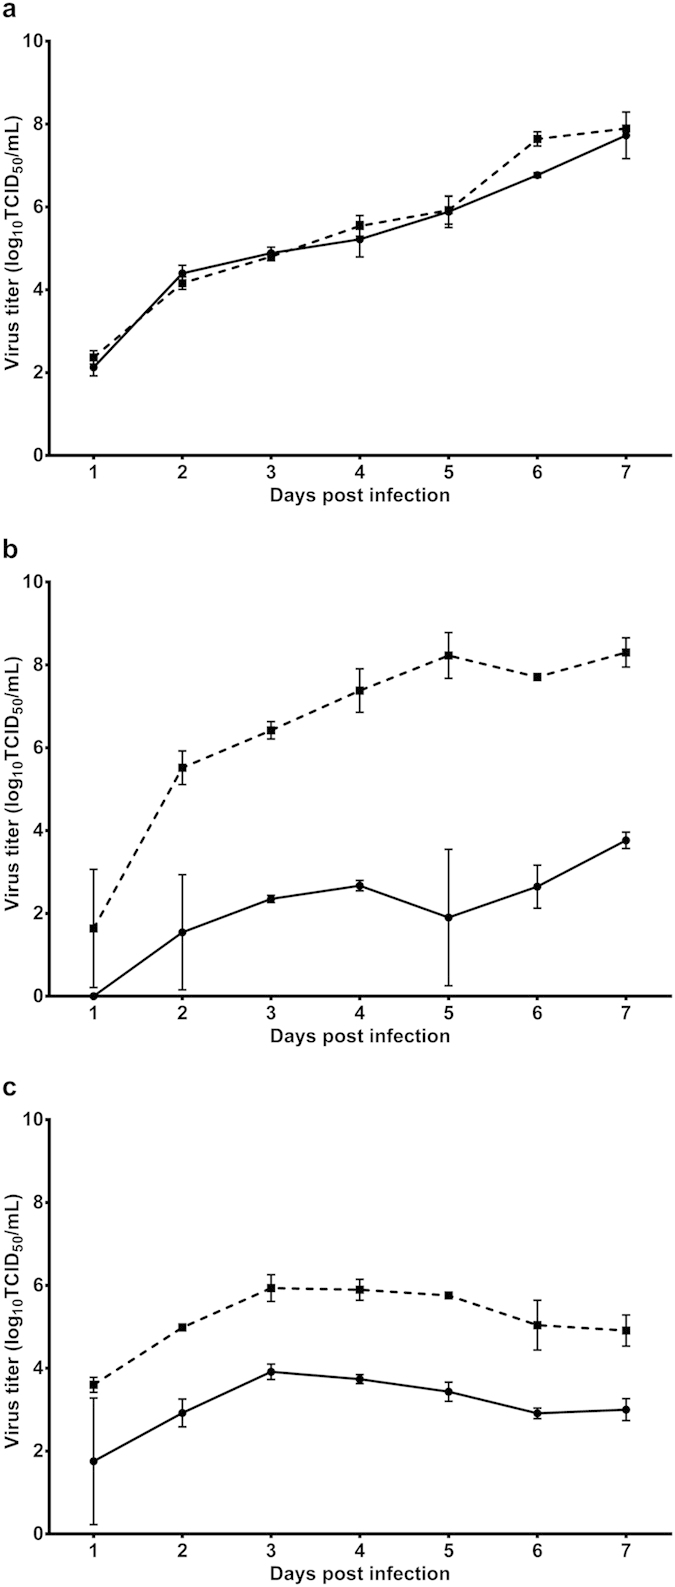
Comparison of replication curves for Brun2014 (solid line) and the urban epidemic strain TSV08 (dashed line) are shown for C6/36 mosquito cells (a) and mammalian Vero and Huh-7 (b,c respectively). Viruses were infected at a multiplicity of infection (m.o.i.) of 0.01 based on respective titers obtained in C6/36 cells. Mean (±SD) viral titers resulting from the average of independent replicates are plotted for each virus. Virus samples were collected daily for 7 days.