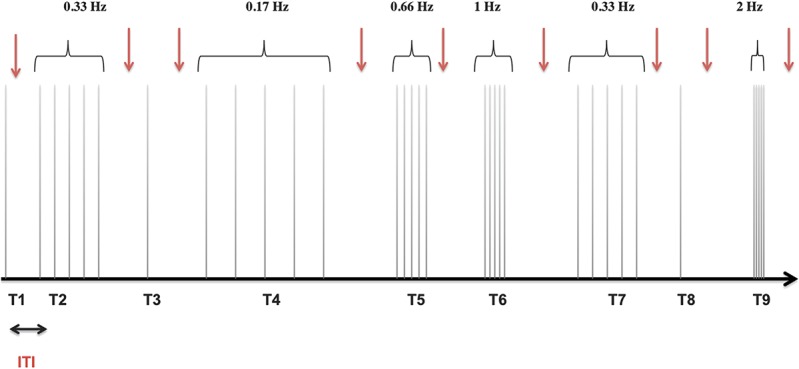
Figure 1.

Temporal summation protocol. In total, 3 trials of 5 electrical stimuli (black vertical lines) for each frequency (0.17, 0.33, 0.66, 1, and 2 Hz) and fifteen single stimuli (control trials) were applied in a pseudorandom order with an ITI of 15 to 30 seconds. Part of these trials (T1, T2…T9) is illustrated. The intensity of the stimulation was 120% of RIII-reflex threshold. Participants rated pain intensity after each trial (red arrow) during the ITI. ITI, intertrial interval.
