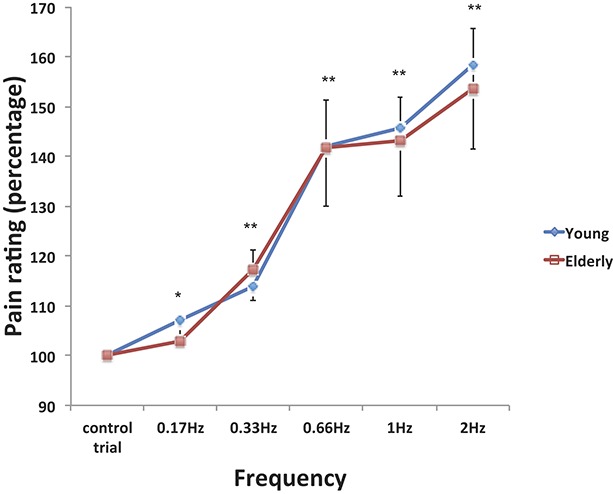
Figure 2.

Temporal summation of pain. The plot represents a comparison of pain ratings (y axis) of young and elderly participants relative to the single-stimulus control condition (100%) after the 5 stimulations administered at each frequency tested. Mean values and SDs of absolute pain ratings are reported in Table 3. There was a significant effect of frequency and a significant increase for each condition relative to the control trials. However, the effect was comparable between groups (interaction P = 0.79) (planned contrasts with control trials: *P < 0.05, **P < 0.01 for pooled data from both groups; see main text for detailed statistical results).
