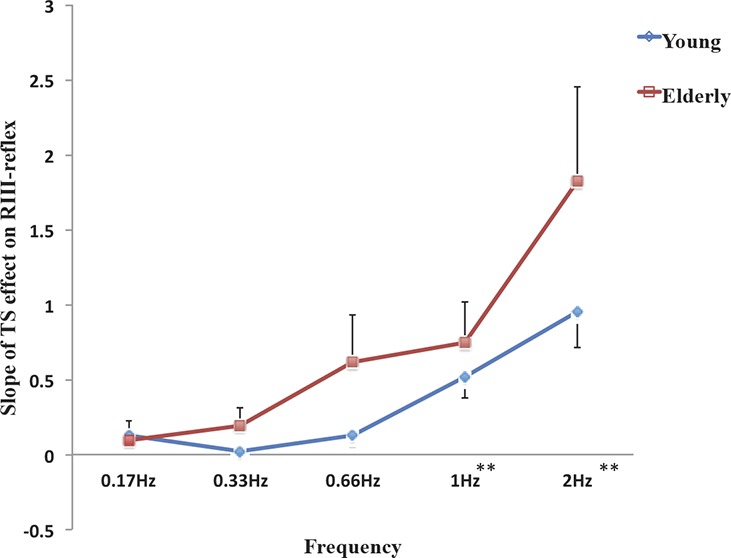
Figure 5.

Slope of temporal summation effect. Comparison of RIII-reflex temporal summation slope for each frequency between groups. A significant effect of the frequency was observed, but this effect was not significantly different between groups. Error bars represent SEM (**P < 0.01 for pooled data from both groups; see main text for detailed statistical results).
