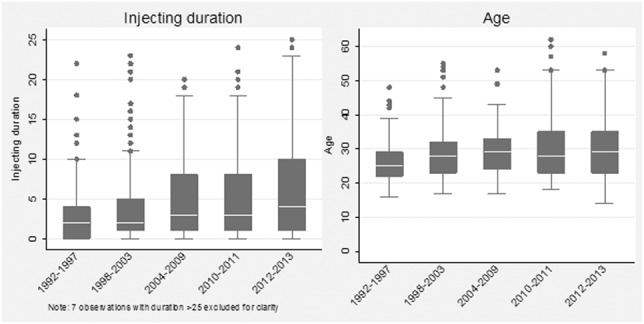
FIGURE 1.

Distribution of reported injecting duration and age (at time of survey) over time, men injecting IPEDs, England and Wales: 1992–2013. Box and whisker plots with medians, 25th and 75th percentiles and whisker defined as 1.5 times the interquartile range.
