
FIGURE 1.
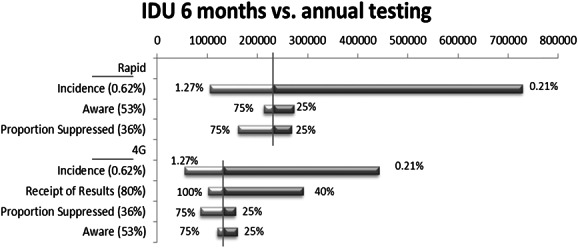
Tornado Diagrams of one-way sensitivity analyses of the cost-effectiveness of semiannual rapid and fourth-generation HIV testing for IDU. The horizontal bar shows the range in cost-effectiveness ($ per QALY saved), given the variation in model parameters and the parameter values explored in sensitivity analyses. The vertical line shows the base case cost-effectiveness. The legend shows base case parameter values. 4G, fourth-generation HIV test.