
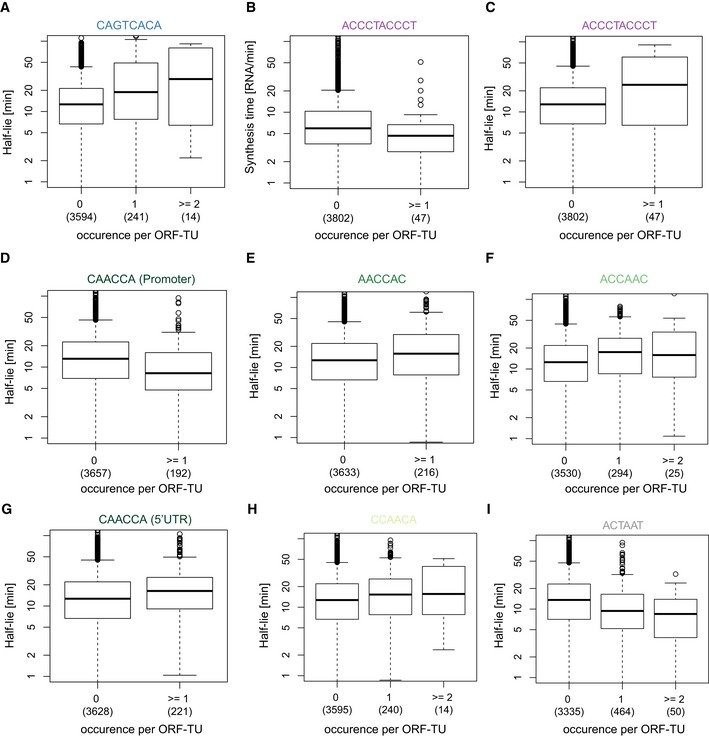
Figure EV1. Distribution of half‐lives and synthesis times versus the number of of occurrences of identified motifs.
-
AQuartiles (boxes) and 1.5 times the interquartile range (whiskers) of the distribution showing the distribution of half‐lives for all ORF‐TUs, grouped by the number of occurrences of the motif CAGTCACA in their promoter sequence. Number of instances per box in parentheses.
-
B–IAs in (A) for all identified motifs and corresponding rates.