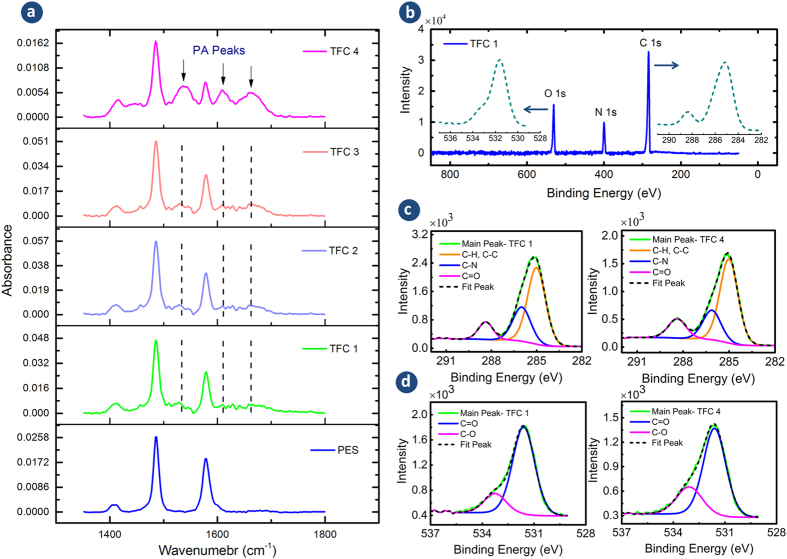
Figure 3.
(a) FTIR spectra (PES support and TFC1-4), (b) XPS survey spectrum (TFC 1) along with high resolution C (1s) and O (1s) spectra, (c) convoluted high resolution C (1s) and (d) convoluted high resolution O (1s) spectra (TFC 1 & TFC4). FTIR shows additional peaks associated with the PA to the PES support. The survey spectrum indicates the presence of O, N and C elements and the absence of S on the surface of the membranes indicating all membranes are integrally skinned. The convoluted high resolution C (1s) and O (1s) peaks provide information about the PA chemical bonds that helps to quantify C=O/C−N ratio. The high resolution C (1s) and O (1 s) spectra of TFC 2 and TFC 3 membranes are presented in Supplementary Information.

