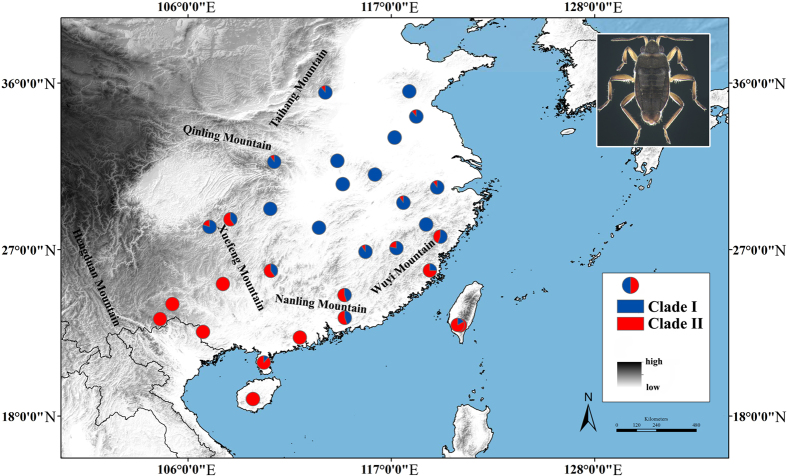
Figure 1. Sample size and halotype frequencies of two major clades of M. horvathi, designated clade I and II according to the molecular phylogeny in Fig. 3a.
Frequencies of clade I and II haplotypes in each population are showed by the pie graph. Names of mountain ranges in the map were labelled. Figure was generated in ArcGIS 10 (Environmental Systems Research Institute).

