
Figure 5. Values of fixation indices (F) as a function of number of groups (K) based on mitochondrial data.
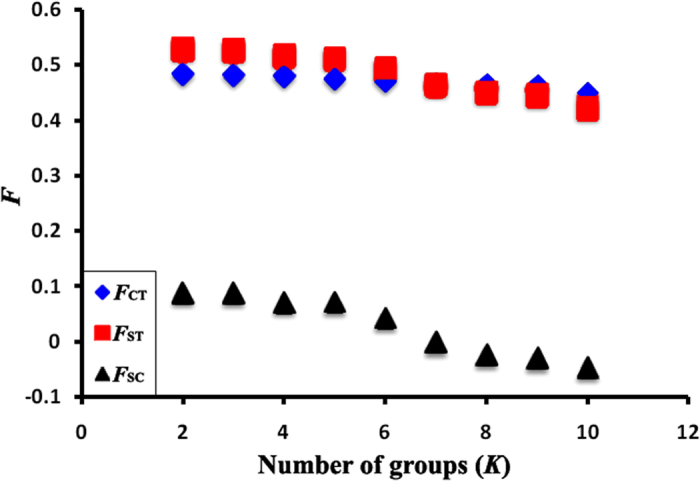
FCT is the differentiation between groups, FST is the differentiation between populations among groups, and FSC is the differentiation between populations within groups.