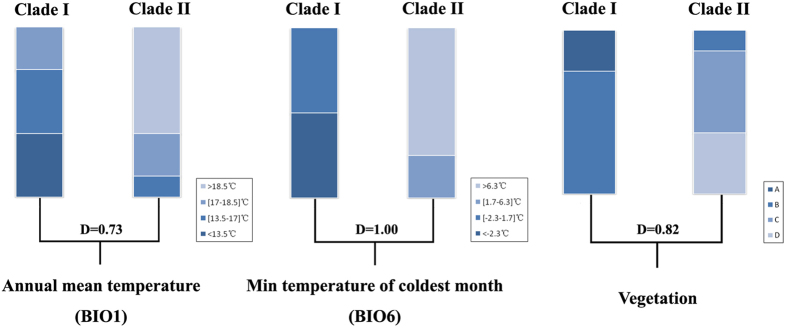
Figure 6. The results of the spatial evolutionary and ecological vicariance analysis (SEEVA) of M. horvathi using annual mean temperature (BIO1), min temperature of coldest month (BIO6) and vegetation type as four qualitative or quantitative section states.
The blue scale of the histograms represents the four different states. Vegetation: A, temperate deciduous forest; B, evergreen broad leaved forest; C, monsoon rain forest/evergreen broad leaved forest; D, island monsoon rain forest.

