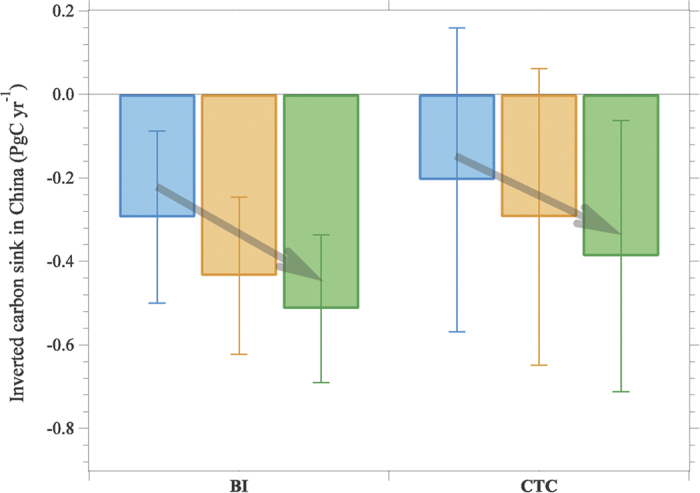
Figure 1. Inverted carbon sinks in China during 2006–2009 from two inversion systems.

Bayesian Inversion (BI) and Carbon Tracker-China (CTC). Values have been adjusted with the national CO2 emissions from fossil fuel burning, cement manufacture, and gas flaring of 1.90 PgC yr−1 during 2006–2009 reported by the Carbon Dioxide Information Analysis Center9. Blue: constrained only with global CO2 datasets; orange: constrained with additional China Meteorological Administration (CMA)’s measurements (3 sites); and green: constrained with additional CMA and CONTRAIL aircraft CO2 measurements.
