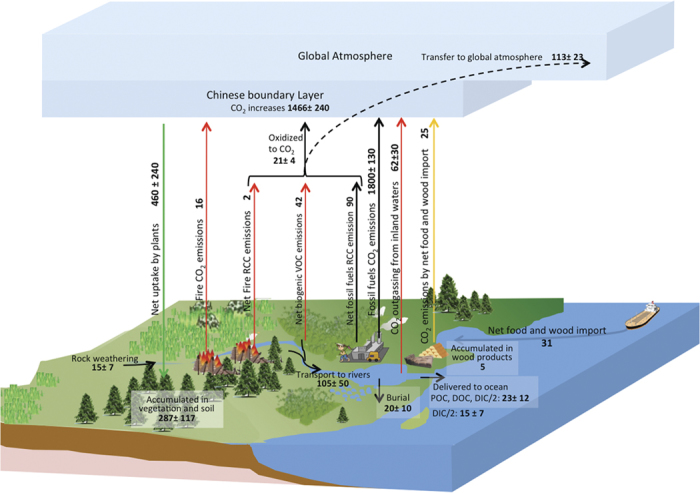
Figure 3. Carbon budgets of China’s terrestrial ecosystems from 2006 to 2009.

Unit: TgC yr−1. The net CO2 flux in the boundary layer of China is 1.47 ± 0.24 PgC yr−1, which is the balance of 1.80 ± 0.13 PgC yr−1 directly emitted by fossil fuels and cement production, 0.016 PgC yr−1 directly emitted by biomass burning, 0.021 ± 0.004 PgC yr−1 converted from RCC which are emitted by fossil fuels, biomass burning and vegetation, 0.025 PgC yr−1 released by the consumption of food and wood imported from outside China, 0.062 ± 0.030 PgC yr−1 degassed from inland freshwaters, and about 0.46 ± 0.24 PgC yr−1 as the net uptake by terrestrial ecosystems. Out of the net uptake, about 0.29 ± 0.12 PgC yr−1 is accumulated in these ecosystems, 0.005 PgC yr−1 is accumulated in the harvested wood products, 0.105 ± 0.050 PgC yr−1 is transported to inland waters, 0.016 PgC yr−1 is emitted due to biomass burning, and 0.044 ± 0.020 PgC yr−1 is net released in the form of RCC. This figure was drew by F. Jiang.
