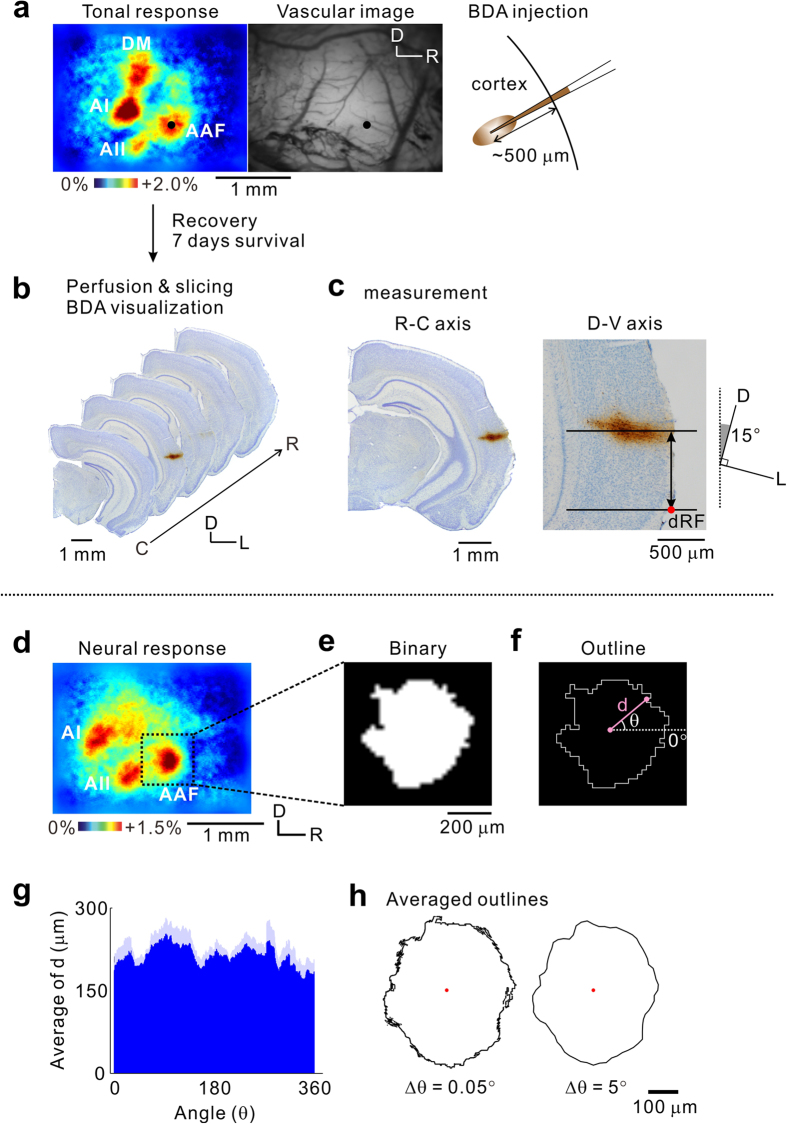
Figure 2. Acquisition of regional coordinates using imaging.
(a) A tonal response to a 30-kHz tone (left). The vascular image on the cortical surface in the same mouse (right). A glass pipette filled with BDA was inserted into the center of the target region (black spots), and BDA was slowly injected by iontophoresis at a depth of 500 μm from the surface. (b) Visualization of BDA. Seven days after the injection, consecutive brain slices were prepared and BDA was visualized. (c) Measurement of the injection site locations. The brain slice with the strongest BDA staining was selected. The rostrocaudal coordinate of the slice was judged by the coronal view in reference to those showed in the Paxinos and Franklin brain atlas20. The dorsoventral coordinate of the injection site was obtained as a distance between the dorsal edge of the rhinal fissure and the line penetrating the center of the BDA-stained area. This measurement was performed after rotating the image by 15°. dRF, dorsal tip of the rhinal fissure. (d) A tonal response to a 5-kHz tone. (e) The image of the tonal response of the AAF, trimmed from the original image of (d). The image was converted into binary by setting the threshold to 60% of the peak value in the AAF response. (f) Edge detection from the binary image. The edge was obtained by applying a Sobel filter to the binary image after the pixel density was increased 2,500 times. (g) The distance between the center and each pixel composing the outline, indicated by d in (f). d values were obtained every 0.05°. The distance value was averaged by angle across five animals. Dark blue, mean data; light blue, standard error of the mean. (h) Averaged outlines. After the averaged outline of the 5-kHz area in the AAF was obtained (left), the outline was downsampled 1/100 to a final angular interval of 5°, to smoothen the outline (right). The red plot indicates the center of the outline. Experiments shown in (a–c) and (d–h) were conducted using different animal groups. C, caudal; D, dorsal; D-V, dorsoventral; L, lateral; R, rostral; R-C, rostrocaudal.

