Figure 2.
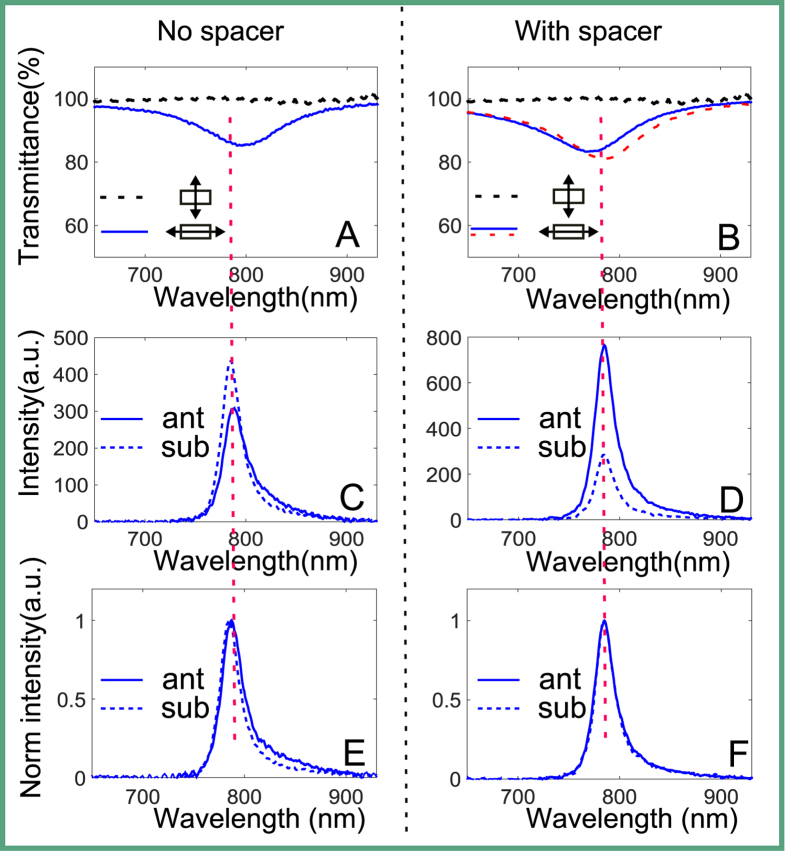
Spectral properties: (A) Transmittance profiles of the sample without spacer obtained by white light spectroscopy, the electric field of the illumination is polarized along the antenna long axis (solid blue line) and perpendicular to the long axis (dashed black line), respectively. (B) Transmittance profile of the sample with spacer before (blue line) and after coating the spacer layer (dashed red line), for illumination with its polarization along the antenna long axis. The transmittance for polarization perpendicular to the antenna’s long axis are identical in this spectral region before and after coating the spacer layer, as shown with dashed black line. (C) PL spectral profiles of the sample without spacer corresponding to points a (solid blue line) and b (dashed blue line) in Fig. 1C, the legend ‘ant’ here means on antenna and ‘sub’ means on substrate (same in the following). (D) PL spectral profiles of the sample with spacer corresponding to points a (solid blue) and b (dashed blue) in Fig. 1D. (E,F) Normalized spectra of (C,D) respectively.

