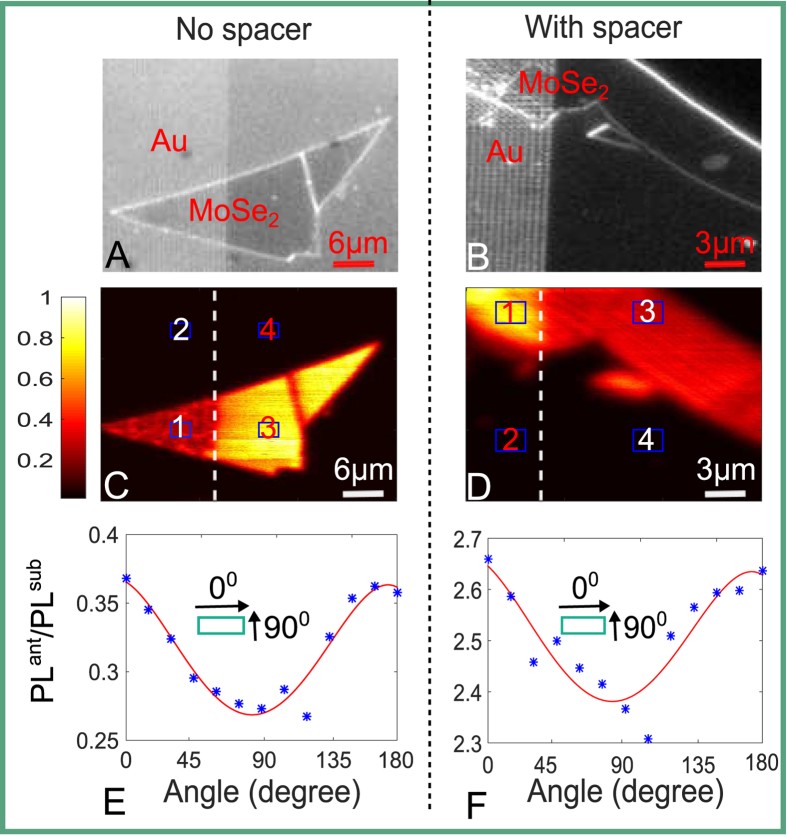
Figure 3.
(A,B) Optical images of two samples, without a spacer and with a spacer, respectively. (C,D) Corresponding typical PL mapping images of the samples integrated over the range 715–1095 nm, both images are normalized to their respective maximum value. (E,F) Corresponding antenna effects varying with collection polarization angles of the two samples, measured data (asterisks) and fitting curves (red solid lines). The insets in (E,F) indicate the direction of polarization with respect to the gold rectangular antenna.

