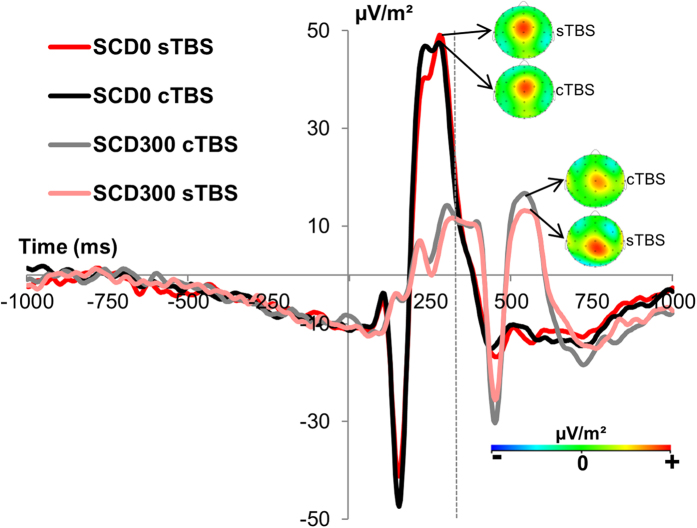
Figure 2. Illustration of the P3 ERPs.
Time point 0 denotes the STOP stimulus presentation and the vertical dashed line denotes the time point of the CHANGE stimulus presentation. The cTBS and sTBS conditions are shown in the SCD0 and in the SCD300 condition. All ERPs are shown for electrode Cz due to the scalp topography. The scalp topography plots show typical maps for the P3 ERPs in the paradigm applied.

