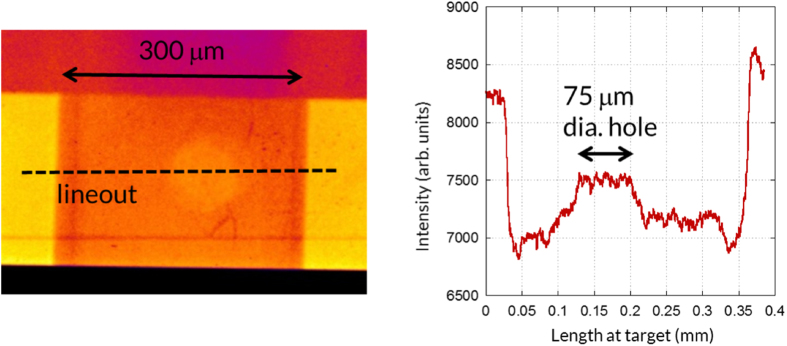
Figure 3.
(left) A sample x-ray radiograph of the tube and 20 mg/cm3 density foam, which was here ionized by the x-rays produced by the long-pulse laser, as recorded on the imaging plate. (right) A lineout was taken across the aligned holes (and along the dashed line shown on the image). It is used to determine the transmission through the foam. Note that the variation of the x-signal across the hole is of the order of 0.7%, and 0.3% of the background x-ray signal over the large area used for deducing the transmission.

