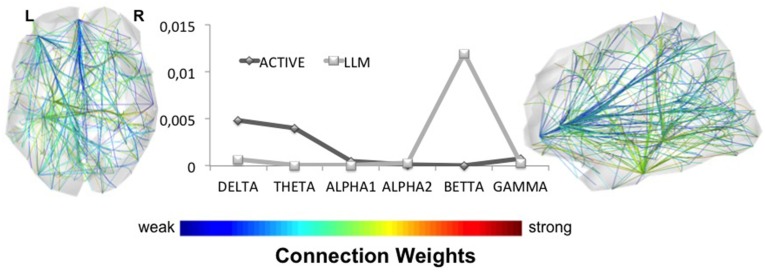
Figure 3.
The line plot illustrates the density of the characteristic networks in all frequency bands. The highest difference between LLM and AC groups is observed for beta brainwaves. The axial and sagittal views of the LLM's characteristic network reveal its topology. LLM alters beta rhythm, while other bands remain almost intact.

