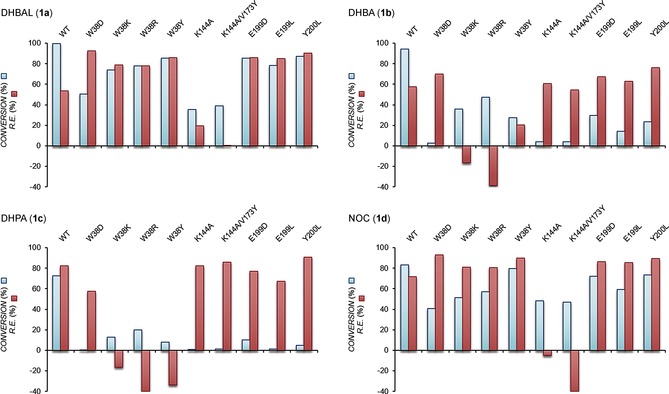
Figure 2.

Activities and regioselectivities of WT COMT and selected mutants. The conversion (blue bar) was calculated as the percentage of initial substrate converted after 20 min to both regioisomeric products combined. The regioisomeric excess (re; red bar) was calculated as the percentage excess of the meta regioisomer over the para regioisomer. Positive re values denote meta‐selectivity, whereas negative re values denote para‐selectivity. For all other mutants, see Tables S1–S4.
