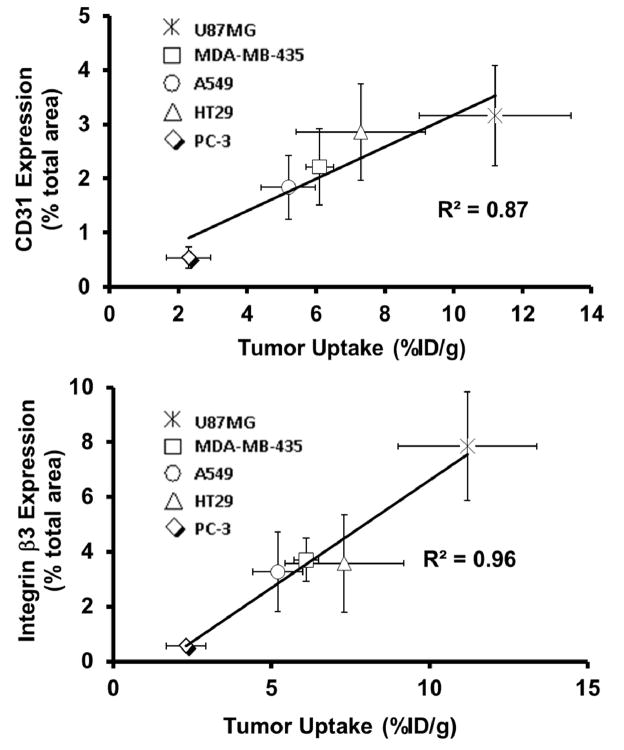
Figure 14.
Relationship between the tumor uptake (%ID/g: radioactivity density) and relative β3 (top) CD31 (bottom) expression levels (fluorescence density) in five different xenografted tumors (U87MG, MDA-MB-435, A549, HT29 and PC-3). The total β3 expression was represented by the percentage of red area over total area in each slice of tumor tissue. Each data point was derived from at least 15 different areas of same tissue (100X magnification). The experimental data were from reference 40.

