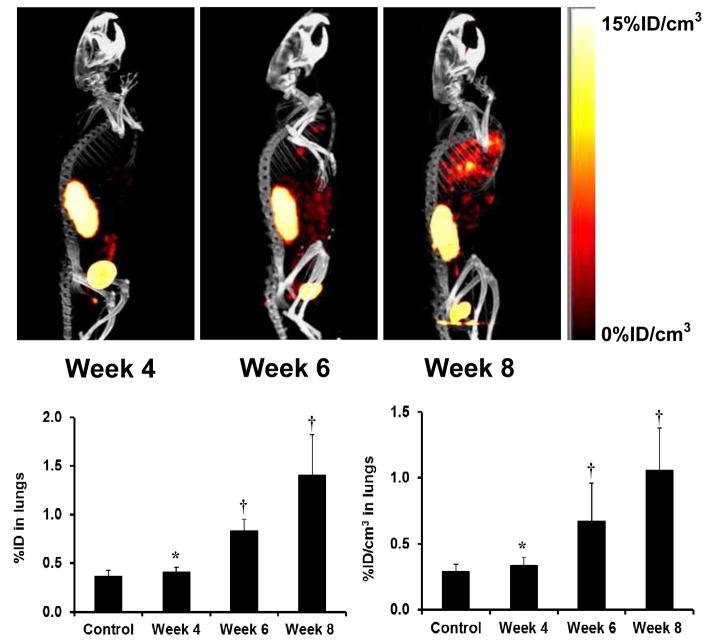
Figure 16.
Top: The 3D views of SPECT/CT images of an athymic nude mouse at week 4, 6 and 8 after tail-vein injection of 1.0 × 10⁶ MDA-MB-231 cells. Bottom: The %ID (left) and %ID/cm3 (right) uptake values of 99mTc-3P-RGD2 in the lungs obtained from SPECT/CT quantification in the athymic nude mice (n = 8) at week 4, 6 and 8 after tail-vein injection of 1.0 × 10⁶ MDA-MB-231 cells. Normal animals (n = 4) were used in the control group. †: p < 0.05, significantly different from the control group; *: p > 0.05, no significant difference from the control group. The imaging and SPECT quantification data were from reference 200.

