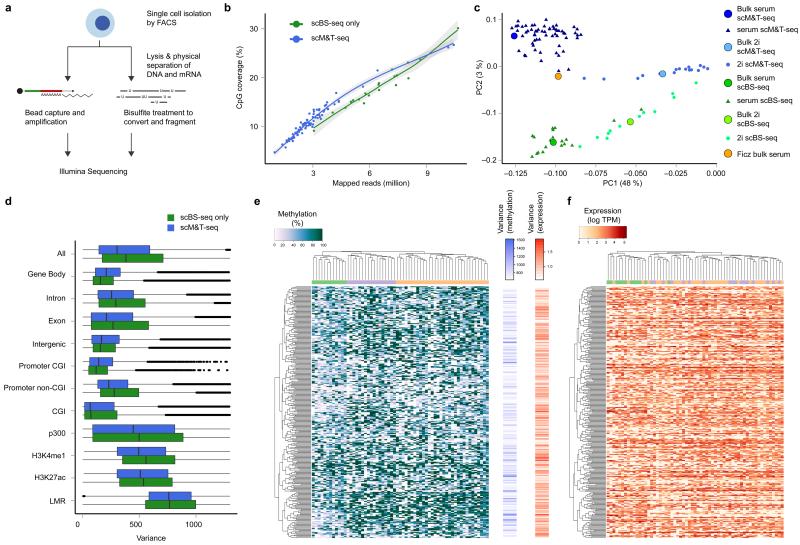
Figure 1. Quality control and global methylation and transcriptome patterns identified in serum ESCs profiled using scM&T-seq.
a) Schematic overview of the scM&T-seq protocol. b) CpG coverage of single cells as a function of the number of mapped sequencing reads. Green: stand-alone scBS-seq3, Blue: scM&T-seq. c) Joint principal component analysis of the methylomes (gene body methylation) of 61 serum ESCs (dark blue) and 16 2i ESCs (light blue) obtained using scM&T-seq, as well as 20 serum ESCs (green) and 12 2i ESCs (yellow) sequenced using stand-alone scBS-seq3. The solid circles correspond to synthetic bulk datasets form the same cells. For comparison, we also included a bulk serum ESC DNA methylation dataset16 (orange). Cell type explained a substantially larger proportion of variance (PC1, 48%) than protocol (PC2, 3%). d) Comparison of epigenetic heterogeneity in different genomic context, either considering 61 serum ESCs obtained using scM&T-seq (blue), or 20 serum ESCs sequenced using stand-alone scBS-seq3 (green). e, f) Clustering analysis of transcriptome and methylation data from 61 serum ESCs, considering gene body methylation (e) and gene expression (f) for the 300 most heterogeneous genes (based on gene body methylation). The order of genes was taken from an individual clustering analysis based on gene body methylation whereas cells were clustered separately either using DNA methylation or expression data, and coloured by methylation cluster. The bar plots in the center show the heterogeneity in DNA methylation (left) and gene expression (right).

