
Fig. 2.
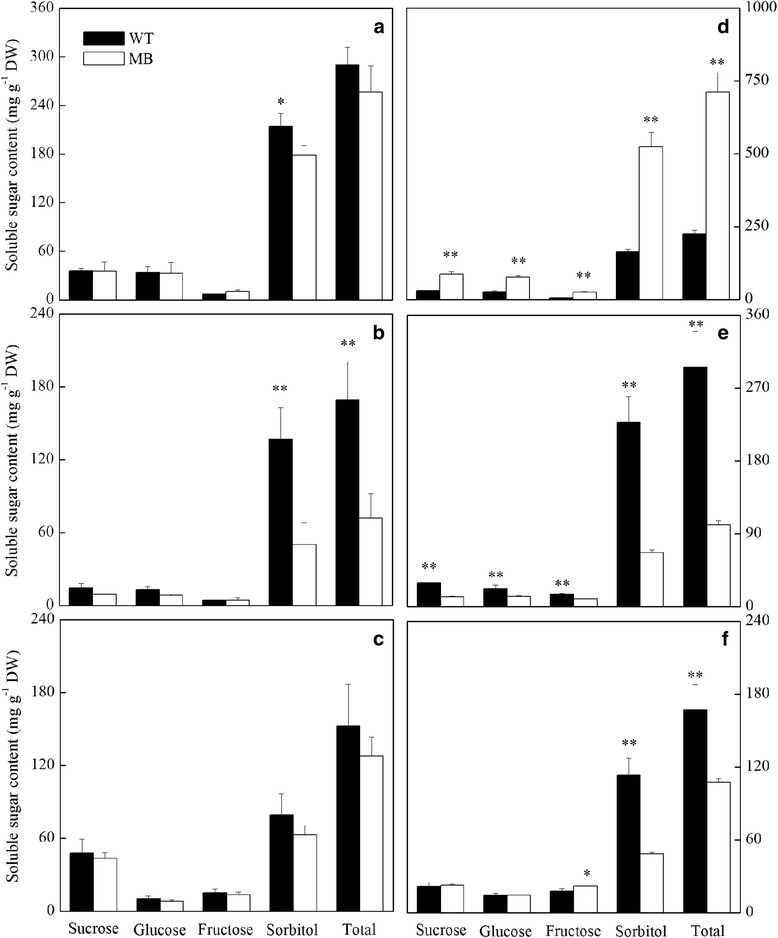
Quantification of soluble sugars in WT and MB grafted apples. Sugar content in leaves (a, d), stems (b, e) and roots (c, f) at the early growth stage (25 DAG, a–c) and the branching stage (60 DAG, d–f). Values are means ± SE (n = 3). Significant differences (*P < 0.05 and **P < 0.01) are based on Student’s t-tests