
Fig. 3.
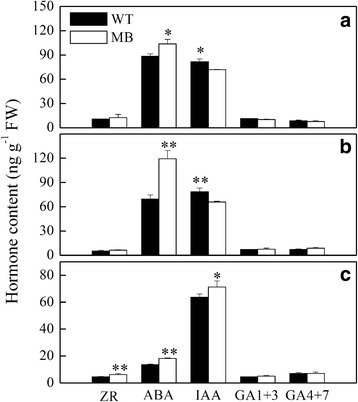
Quantification of free ZR, IAA, GAs and ABA in WT and MB grafted apple. Hormone content in shoot tips (a), stems (b) and roots (c) at the branching stage (60 DAG). Values are means ± SE (n = 3, with three technological duplicates). Significant differences (*P < 0.05 and **P < 0.01) are based on Student’s t-tests