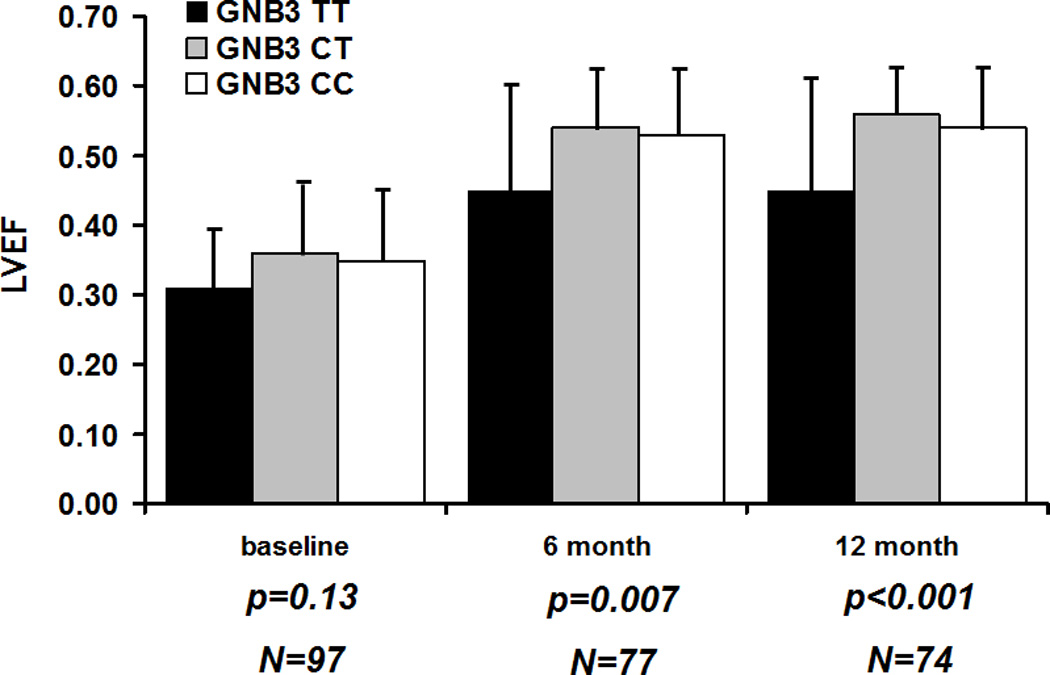
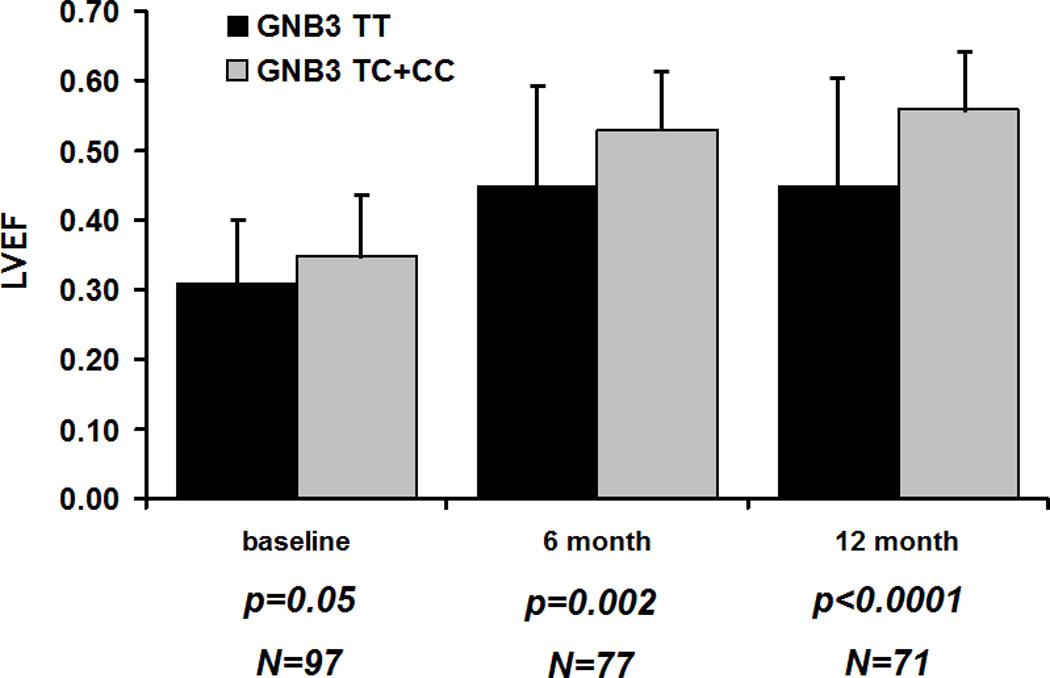
Figure 1. LVEF over time (entry, 6 and 12 months post-partum) by GNB3 Genotype.


A. Comparison of three genotype classes: Women homozygous for GNB3 T (black bars), heterozygous women (gray bars) and those homozygous of the C allele (white bars). Lines extending from bars represent standard deviations. P values represent an analysis of variance (ANOVA) of an overall difference between the three genotype classes. No significant difference at entry (p value=0.13) but a significantly lower mean LVEF for GNB3 TT subjects at 6 (p=0.007) and 12 months (p<0.001).
B. Same comparison but combining heterozygous subjects and those homozygous for the C allele into one group. Subjects homozygous for GNB3 T (black bars) compared to subjects with the C allele (gray bars). Not statistically significant at entry (p value=0.054) but a significantly lower mean LVEF for GNB3 TT subjects at 6 (p=0.002) and 12 months (p<0.0001).
