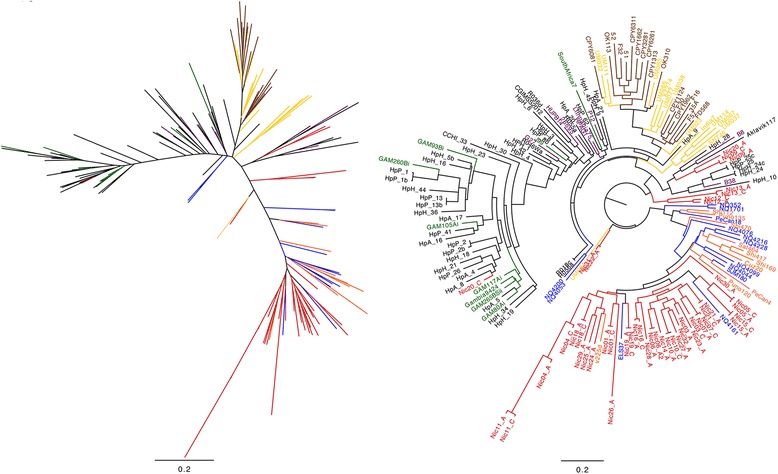
Fig. 4.

Maximum likelihood (PhyML) tree based on alignment of the 170 BabA protein sequences. Nicaraguan isolates are shown in red, urban South- and Central American isolates are shown in blue, North American isolates in black, African isolates in green and European isolates in purple, EastAsian isolates in brown, other Asian isolates in yellow and Amerindian isolates in orange
