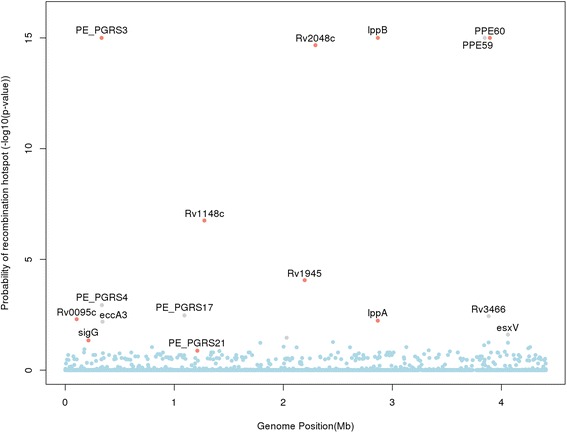
Fig. 3.

Evidence of recombination at a gene level. A Manhattan plot showing genes that are likely to be recombination hotspots. The (−log10) p-value for recombination is plotted against genome position. All genes with p-values <0.05 are labelled. Genes labelled in colour grey (eccA3, pe_pgrs4, pe_pgrs17, ppe59, Rv3466 and esxV) become statistically non-significant after removing sites under selection
