Figure 3.

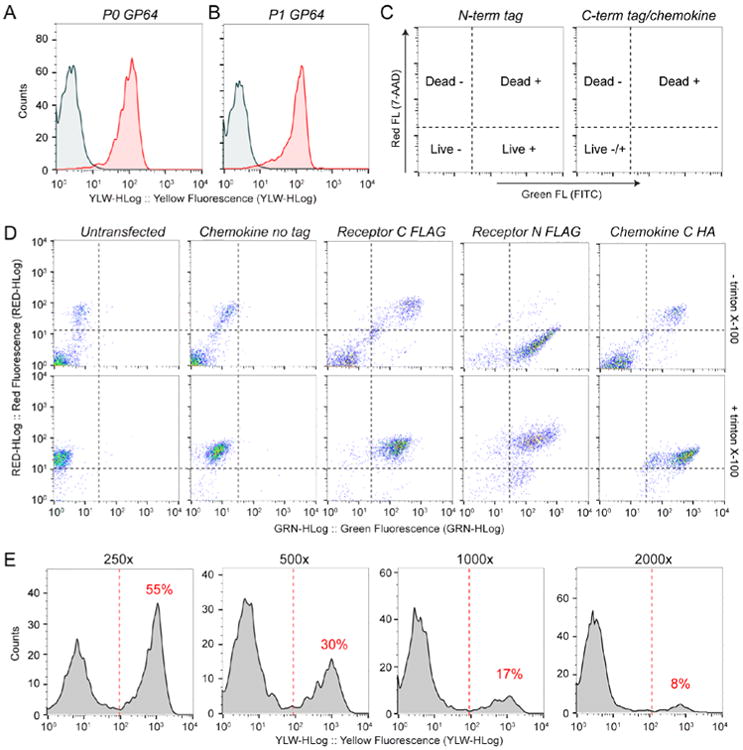
Baculovirus production detected by flow cytometry. A-B.) P0 and P1 virus expression detected by PE conjugated anti-GP64 antibody. C.) Interpretation of FITC assay for expression of receptor and chemokine. D.) FITC assay results for receptor and chemokine samples. Control experiments (columns 1 and 2) were acquired with an anti-FLAG FITC conjugated antibody, identical results were obtained with anti-HA FITC antibody (data not shown). Note that due to their larger size, cells expressing untagged chemokine have higher non-specific antibody binding than untransfected cells. Receptor and chemokine experiments (columns 3-5) were acquired with FITC conjugated FLAG or HA antibodies as indicated in the figure. Samples in the bottom row contained 0.0075% triton X-100 to permeabilize the cells. E.) Titer of P1 virus using the GP64 assay and serial virus dilutions as indicated above each plot. The % infected cells of each dilution is shown in red above the infected population in each plot.
