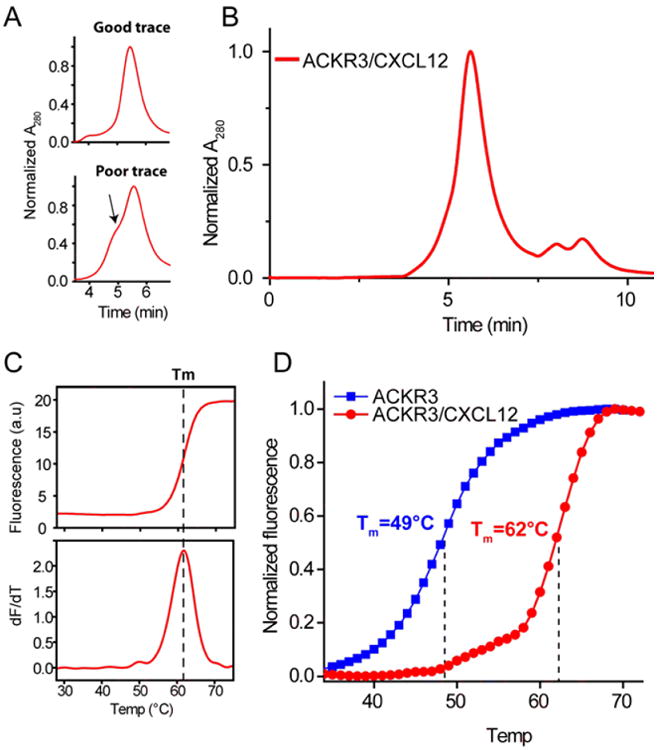
Figure 6.

Characterization of receptor/chemokine complexes. A.) Analytical SEC traces of varying quality. The top trace has a sharp, symmetric peak while the peak in the bottom trace has a shoulder (indicated by arrow), which is a sign that the sample is partially aggregated. B.) Analytical SEC trace of the ACKR3/CXCL12 complex. C.) CPM measurements are used to determine the midpoint of thermal unfolding (Tm) of the receptor. Data can be plotted either as CPM fluorescence as a function of temperature (top) or as the derivative of the fluorescence (bottom) D.) CPM experiments with apo ACKR3 and the ACKR3/CXCL12 complex.
