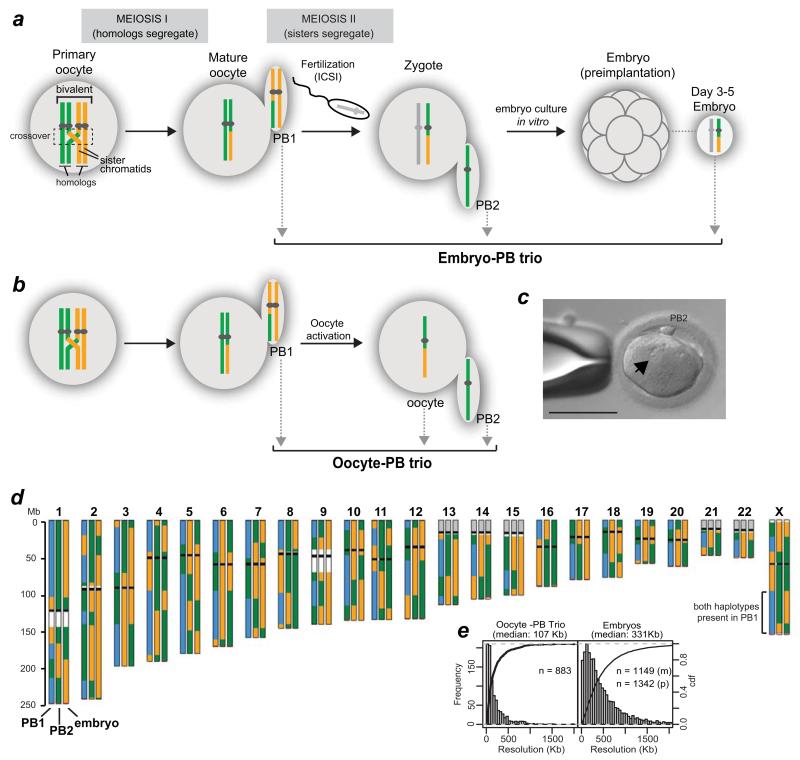
Figure 1.
Human MeioMaps from embryos and oocytes together with their corresponding polar bodies.
(a,b) The genotypes of the two maternal chromosomes are shown as green and yellow. Crossovers, shown in the dashed box, occurs during foetal development. The two polar bodies were sequentially biopsied (grey arrows) to avoid misidentification. Maternal MeioMaps were deduced from the embryo following intracytoplasmic sperm injection (ICSI) or directly assessed in the haploid oocyte, after artificial activation (b).
(c) An activated oocyte with a single pronucleus (arrow) and PB2. Scale bar: 110 μm.
(d) An example of a MeioMap after genome-wide SNP detection and phasing (see Methods). Each chromosome is represented by three vertical columns representing the three cells of the trio (PB1, PB2, and embryo or oocyte). The two phased maternal haplotypes are represented by green and yellow. Blue represents the detection of both haplotypes. Regions where SNPs are not available on the array are shown in white (repetitive sequences on chr. 1 and 9) or gray (rDNA). Black bars illustrate the position of the centromere. Red bars shows the last informative SNPs to call. Crossovers are manifested as reciprocal breakpoints in haplotypes (green to yellow, blue to green, etc.) in two of the three cells. Note that the colours of the haplotype blocks between different chromosomes are not necessarily derived from the same grandparent. Histograms of the resolution of the crossovers are shown in (e). The resolution was 352 Kb and 311 Kb for maternal (m) and paternal (p) crossovers in the embryos, respectively.

