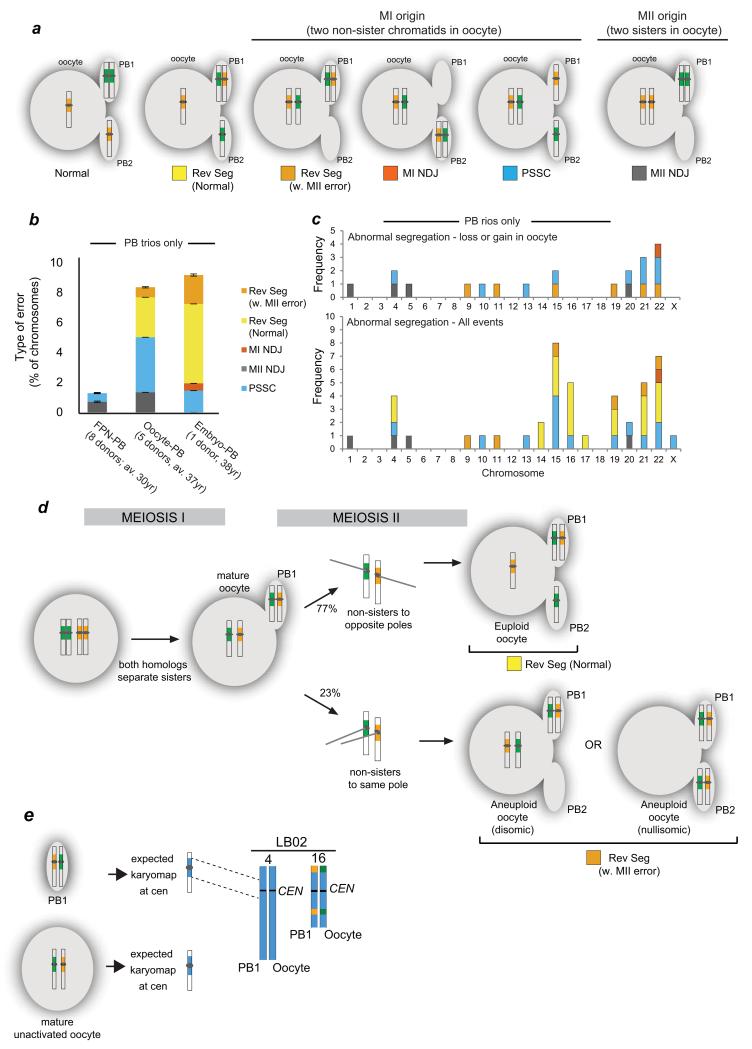
Figure 2.
MeioMaps reveal origin of aneuploidies and a novel chromosome segregation pattern.
(a) Segregation patterns revealed from following the pericentromeric haplotypes (yellow and green around centromere) in all three products of female meiosis. Only examples leading to trisomic conceptions are shown. For all possible segregation patterns detected by Meiomapping see Supplementary Figure 3. MI NDJ: meiosis I nondisjunction; Rev Seg reverse segregation; PSSC: precocious separation of sister chromatids; MII NDJ: meiosis II nondisjunction.
(b) Incidence and type of segregation errors in oocyte-PB and embryo-PB trios. Errors detected in MeioMaps generated from the female pronucleus (FPN-PB) from a younger donor population10 are shown for comparison. The number of donors and average (av.) age are shown. Age ranges were 25-35 for FPN-PB10 and 33-41 for oocyte-PB trios. The embryo donor was 38 years (Supplementary Table 1 and 2). Bars: standard error of a proportion.
(c) PB trios.
(d) Inferred mode of reverse segregation (Rev Seg). Frequencies are shown in Table 2. Alternative segregation outcomes at meiosis II (euploid and aneuploid, n = 26; p < 0.025; binomial exact test with correction for continuity).
(e) Detection of the inferred intermediate of reverse segregation, a mature oocyte and PB1 containing two non-sister chromatids each. Two mature oocytes that contained a PB1 but were unactivated were biopsied and the SNPs detected genome-wide. The expected chromosome fingerprints that contained heterozygous SNPs around the centromeres are shown in blue. Two examples were found in this egg (chromosomes 4 and 16; Table 2).

