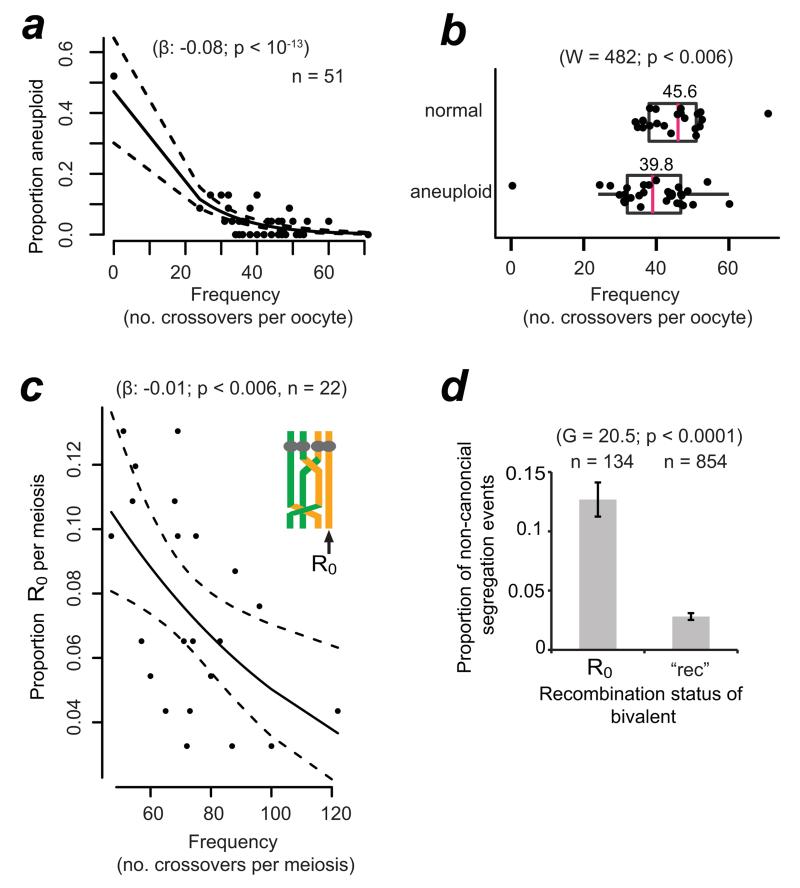
Figure 4.
Higher global recombination rates protect against aneuploidy and are selected for in the human female germline.
(a) Logistic regression of the frequency of aneuploid chromosomes as a function of global recombination rate in the embryo or oocyte. Black lines shows logistic regression model and 95% confidence interval (dashed line; binomial family). When the outlier with 0 recombination events was omitted, the regression coefficient β was −0.06 and still highly significant (p < 0.003). The outlier was omitted from all subsequent statistical analyses.
(b) Recombination rates in normal versus aneuploid oocytes and embryos. The arithmetic mean is shown above of the median (magenta, vertical bar). Statistics: Mann-Whitney-Wilcoxon test; one-sided.
(c) Incidence of bivalents containing at least one non-recombinant chromatid (R0) as a function of global recombination rates in oocyte-PB and embryo-PB trios. Statistics as in (a).
(d) Segregation errors amongst chromosomes that contained one or more R0 or where all four chromatids had recombined (‘rec’). p-values from G-test of heterogeneity (two-sided) are shown. Bars represent standard errors of a proportion (√[p ×(1−p)/n]).

