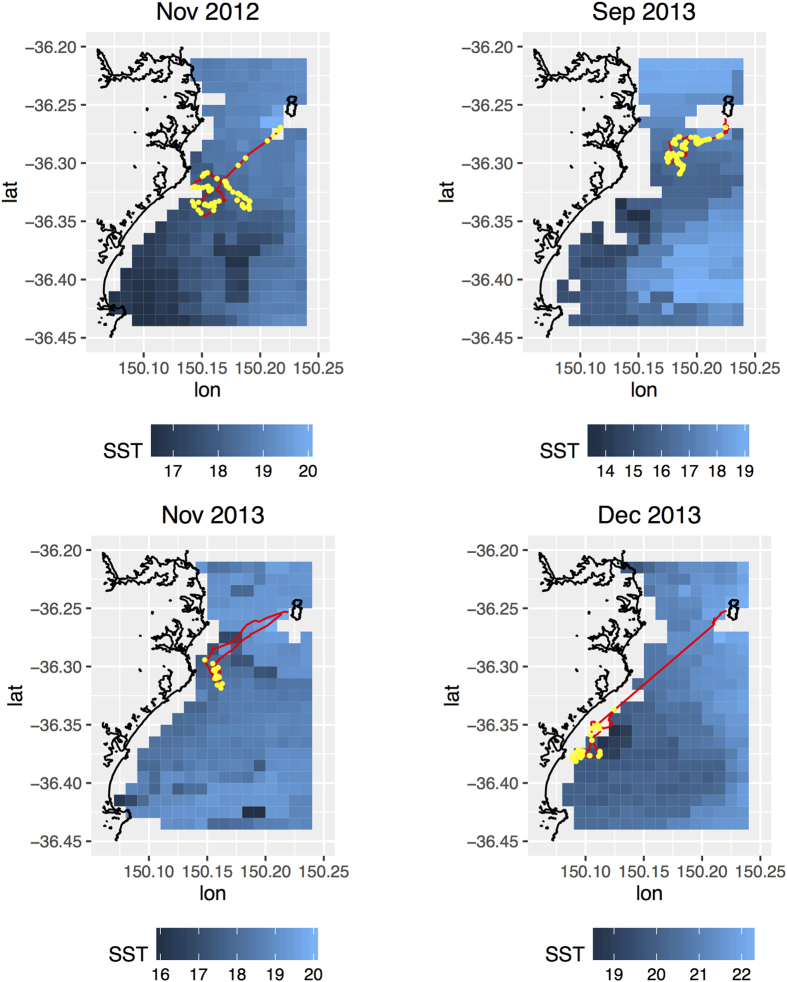
Figure 5. Sample foraging trips by little penguins in relation to gridded sea surface temperature (http://imos.aodn.org.au/imos/), showing foraging trajectory (red) and prey capture locations (yellow).
Panels have different scales in order to highlight penguin habitat selection relative to the distribution of sea surface temperatures within each period. Plot created using ggplot264 in R version 3.2.327.

