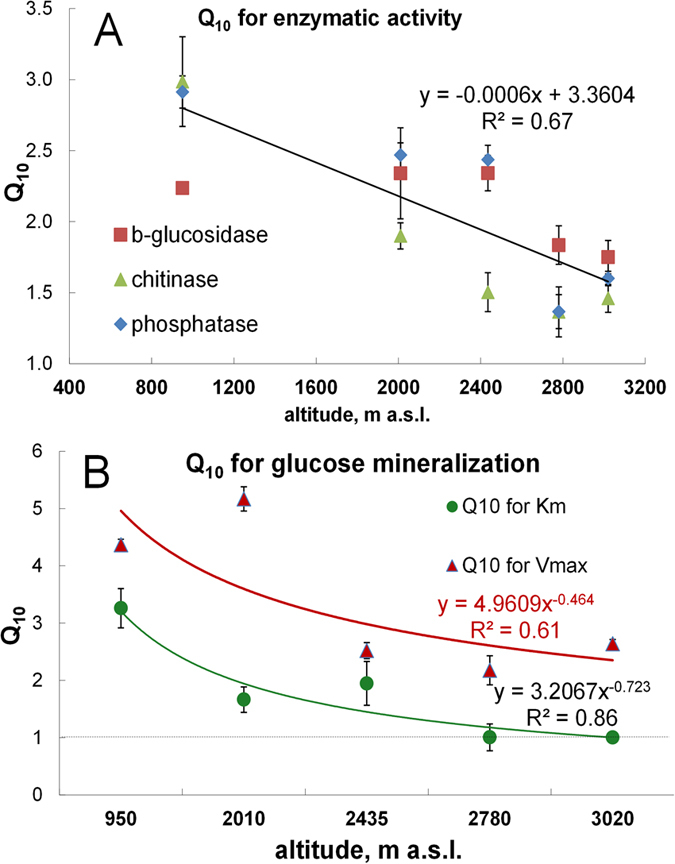
Figure 3.

The Q10total values for hydrolytic enzyme activity at saturating substrate concentrations (A) and the increase in Vmax and Km induced by a temperature increase from 10 to 20 °C for 14C-glucose oxidation (B) depending on altitude. Symbols – experimentally derived values for Q10total (B), Q10Vmax, and Q10Km (A). Lines are the trend-lines obtained by the best fitting of power (A) and linear functions (B) at P values < 0.05, bars show standard deviations of the means (n = 3).
