
Figure 4.
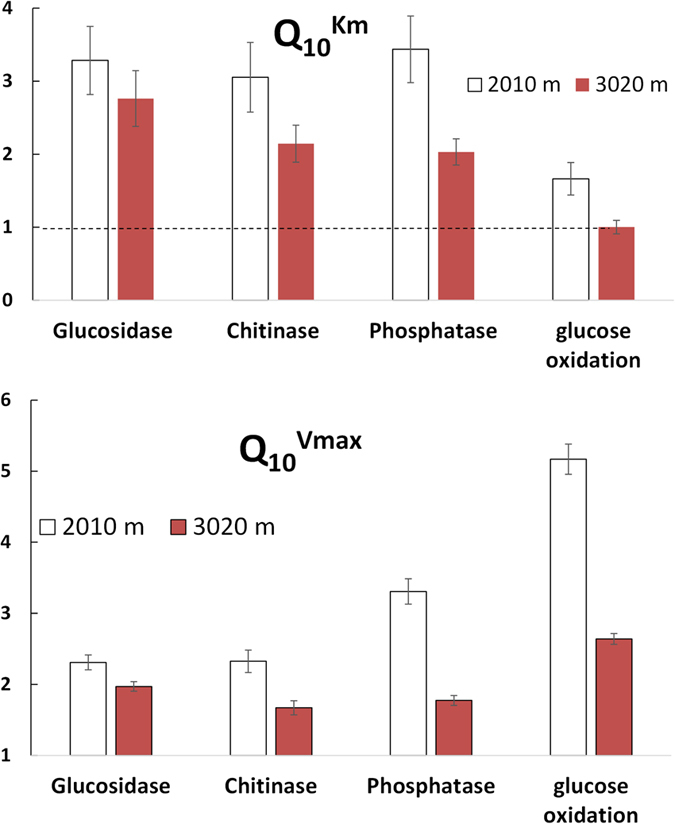
The values of Q10Km (a) and Q10Vmax (b) for hydrolytic reactions and for reactions of glucose oxidation at low and high altitudes. Bars show standard deviations of the means (n = 3).
Official websites use .gov
A
.gov website belongs to an official
government organization in the United States.
Secure .gov websites use HTTPS
A lock (
) or https:// means you've safely
connected to the .gov website. Share sensitive
information only on official, secure websites.
The values of Q10Km (a) and Q10Vmax (b) for hydrolytic reactions and for reactions of glucose oxidation at low and high altitudes. Bars show standard deviations of the means (n = 3).