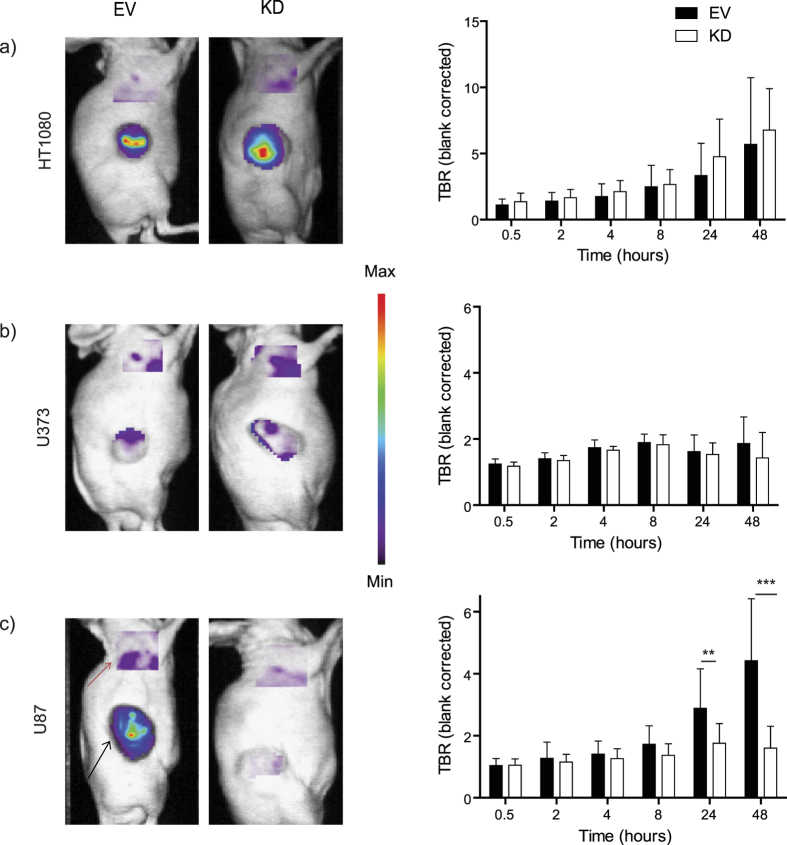
Figure 3. aMMP2-SIP uptake in MMP2 knock-down models compared to control.
Representative images at optimal time point 48h.p.i. (Black arrow indicates tumor, red arrow indicates background) and TBR at various time points for (a) HT1080 (control n = 13, MMP2-KD n = 16), (b) U373 (control n = 6, MMP2-KD n = 6) and (c) U87 (control n = 8, MMP2-KD n = 15) (***P < 0.001, **P < 0.01).

