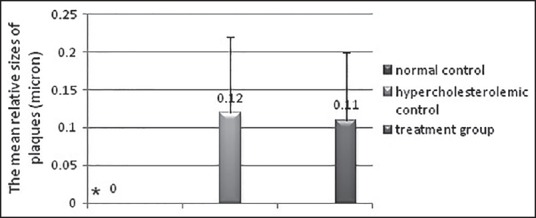
Figure 2.

The relative mean of atherosclerotic plaque thickness in the groups under study; Results are shown as mean ± SD; *Significance of difference compared to the hypercholesterolemic control group (P < 0.05)

The relative mean of atherosclerotic plaque thickness in the groups under study; Results are shown as mean ± SD; *Significance of difference compared to the hypercholesterolemic control group (P < 0.05)