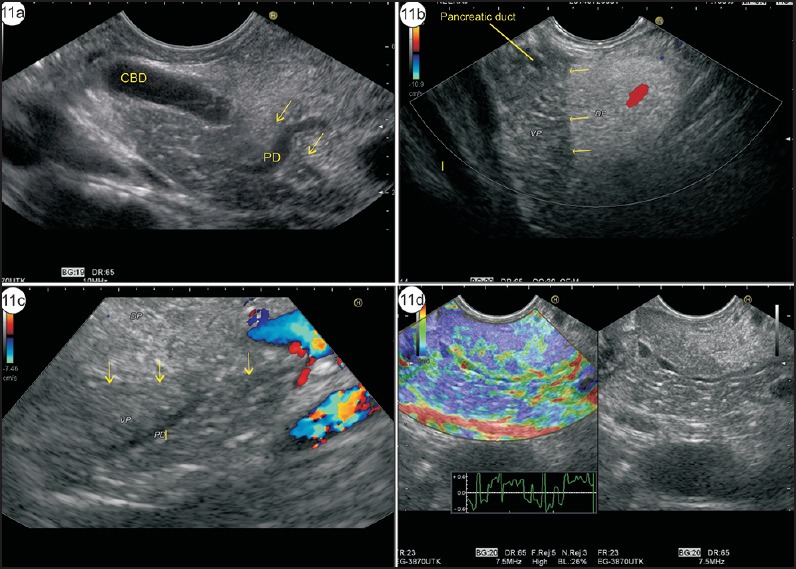
Figure 11.

(a) Imaging from stomach shows hyperechoic DP close to the probe and hypoechoic VP close to the portal vein. The CBD lies closer than the pancreatic duct. The main pancreatic duct is seen moving from DP to VP. The yellow arrows show the transition (DP–VP) zone. (b) Imaging from duodenal bulb shows hypoechoic VP and hyperechoic DP. The main pancreatic duct is seen within hypoechoic VP. The yellow arrows show the transition zone. (c) The imaging of DP–VP zone can be done from descending duodenum. In these two different cases, the transition zone of hyper- and hypoechoeic pancreas is seen from the duodenum and the Wirsung duct is seen traversing from hypoechoic VP to hyperechoic DP. (d) The imaging of DP–VP zone is seen traversing from hypoechoic VP to hyperechoic DP. The elastography image shows no difference in the characteristics of VP and DP
