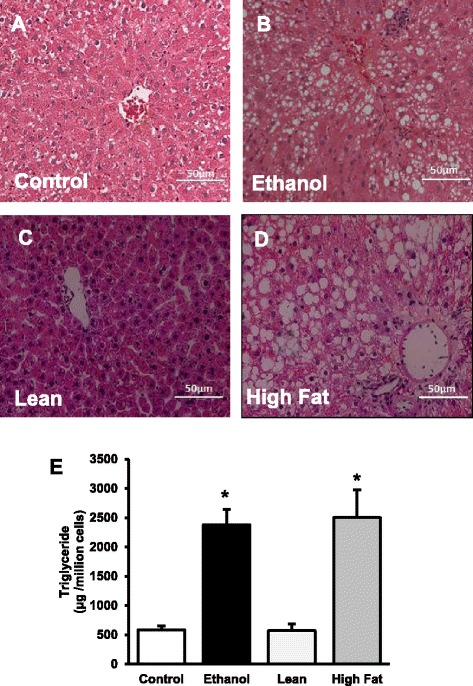
Fig. 1.

Triglyceride accumulation in the hepatocytes of control and EtOH-fed rats (a, b) and of lean and HFD rats (c, d). Hematoxylin and Eosin staining was performed on paraffin sections. Images are representative of each pair-fed group of n = 8. Magnification, 200×. e Quantification of lipid content in isolated hepatocytes. Hepatocyte TGs were extracted with chloroform: methanol (2:1) and amount of glycerol were measured in each sample. TG levels were significantly increased in both AFLD and NAFLD rats when compared to their respective controls. Values are means ± SEM, n =8, *p ≤ 0.05
