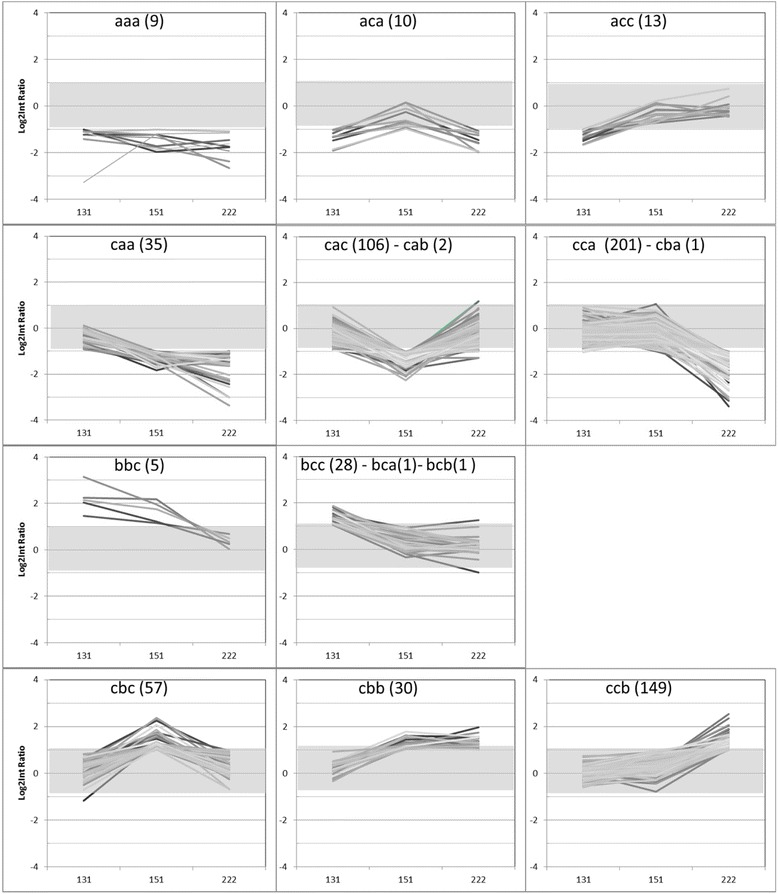
Fig. 4.

Gene expression profiles visualized in a user-defined number of 11 groups. At each sampling date, each gene was tagged as “a” if its log2 ratio was less than −1, “b” if its log2 ratio was more than 1 or “c” if it exhibited no differential expression. Groups are numbered 1–11 (by rows and from left to right), and the total number of genes per set is noted into parentheses. For each diagram, the x-axis shows the three time points (day 131, 151, and 222), while the y-axis corresponds to fold change in the set of genes. Negative log2 ratio corresponds to transcripts up-regulated in trees inhibiting flowering (‘ON’), and positive log2 ratio corresponds to transcripts up-regulated in trees initiating flowering (‘OFF’). The grey domain indicates the −1 and +1 limits used to filter gene expression
