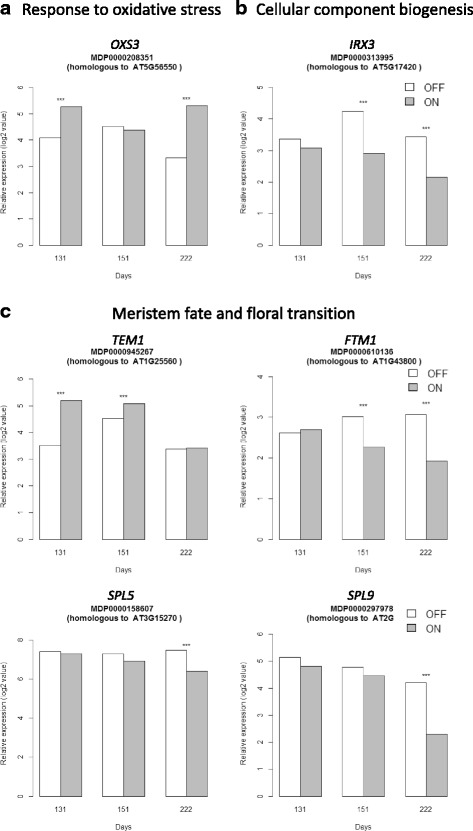
Fig. 6.

Kinetics of the relative expression values (log2 ratio) of transcripts differentially expressed involved in response to oxidative stress (a), cellular components biogenesis (b) and meristem fate and floral transition (c) in apple spur apical buds between trees initiating flowering (‘OFF’) and trees inhibiting flowering (‘ON’) at three developmental stages (day 131, 151 and 222). The array data were normalized with the lowess method. Normalized intensities (i.e. expression levels) were then subtracted from the background. Stars (***) indicate significant differences of expression between the two treatments
