
Fig. 5.
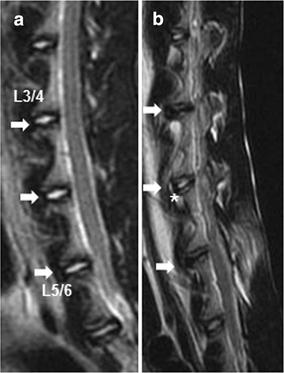
Representative magnetic resonance image (MRI) of the discs before surgery (a) and after surgery (b). Significant low T2-weighted signal intensity was clearly visible at the three experimental levels after surgery. The white asterisk indicates the partial loss of T2 signal intensity. The arrows indicate the operated disc